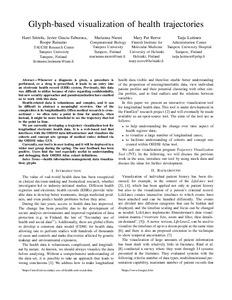
Glyph-based visualization of health trajectories
Siirtola, Harri; Gracia Tabuenca, Javier; Raisamo, Roope; Niemi, Marianna; Reeve, Mary Pat; Laitinen, Tarja (2022)
IEEE
2022
This publication is copyrighted. You may download, display and print it for Your own personal use. Commercial use is prohibited
Julkaisun pysyvä osoite on
https://urn.fi/URN:NBN:fi:tuni-202302082163
https://urn.fi/URN:NBN:fi:tuni-202302082163
Kuvaus
Peer reviewed
Tiivistelmä
Whenever a diagnosis is given, a procedure is performed, or a drug is prescribed, it leads to an entry into an electronic health record (EHR) system. Previously, this data was difficult to utilize because of rules regarding confidentiality, but new security approaches and pseudonymization have enabled us to work with this data. Health-related data is voluminous and complex, and it can be difficult to abstract a meaningful overview. One of the complexities is its longitudinality. Often medical research is cross-sectional - we often take a point in time for analysis, when instead, it might be more beneficial to see the trajectory that led to the point in time. We are currently developing a trajectory visualization tool for longitudinal electronic health data. It is a web-based tool that interfaces with the OHDSI data infrastructure and visualizes the cohorts and concept sets (groups of medical codes) defined via the OHDSI Atlas GUI. Currently, our tool is in user testing and it will be deployed to a wider user group during the spring. The user feedback has been positive. Users find the tool especially useful in understanding and debugging their OHDSI Atlas cohort definitions.
Kokoelmat
- TUNICRIS-julkaisut [16944]